Information is the key to running your estate as efficiently as possible. Huge energy savings can be made by optimising your site, and costs can be reduced by being able to identify and respond to, problem areas quickly. Quite simply, the more information you have, the better equipped you are to reduce your energy bills.
With SMARTset, all of the information you need is available in one application, from estate-wide overviews to precise details about specific equipment. The data is measured and presented in real-time, via SMARTset’s wide variety of displays. These include heat maps, room layouts, graphs, charts, and reports, all of which make it easy to monitor every part of your estate at any level.
SMARTset as a Network Operating Centre
SMARTset allows you to view information about your estate at any level, and so can be used as a Network Operating cCentre (NOC). Whether you want an overview of a group of assets (data centres, cabins, street furniture, etc.) or specific information about one particular sensor, SMARTset makes it easy to access the information you need.
At the highest level, you can view a map of the locations of your sites. Information about each site is displayed in a side-panel.
Select the site circle, and SMARTset displays the Site dashboard, which provides more information about that specific site.
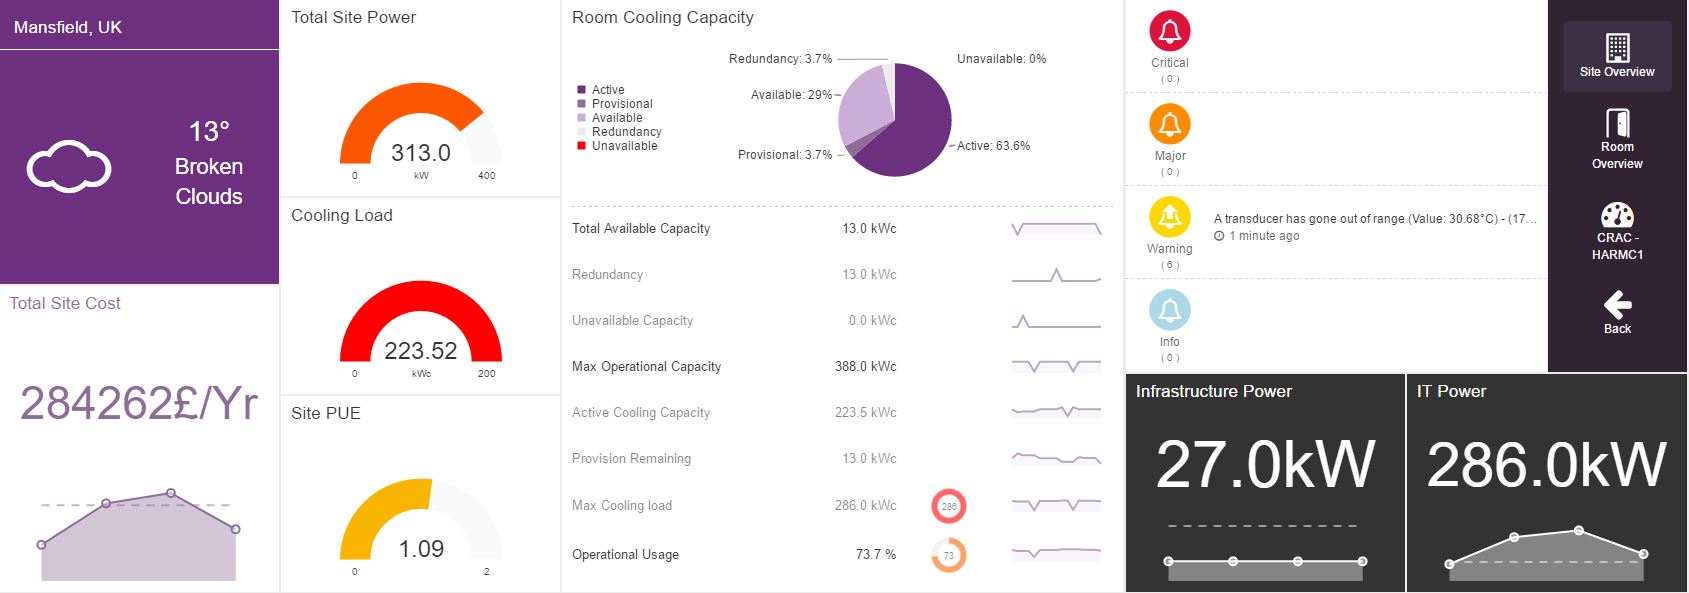
From the Site dashboard, you can access System and Room dashboards.
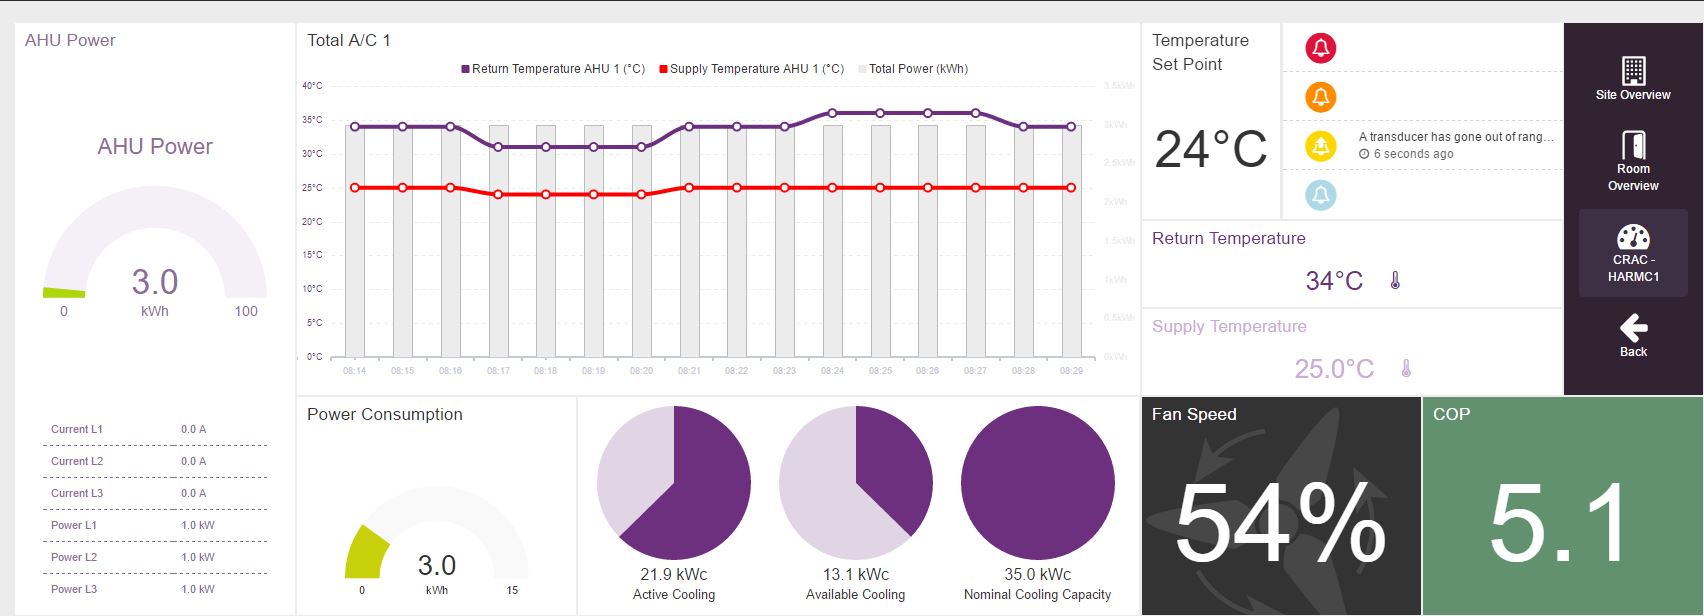
System dashboards provide you with information about electrical circuits, cooling or chiller water systems. The layout shows a schematic of the system, and if you select a sensor on the schematic, SMARTset presents information about that sensor in a pop-up.
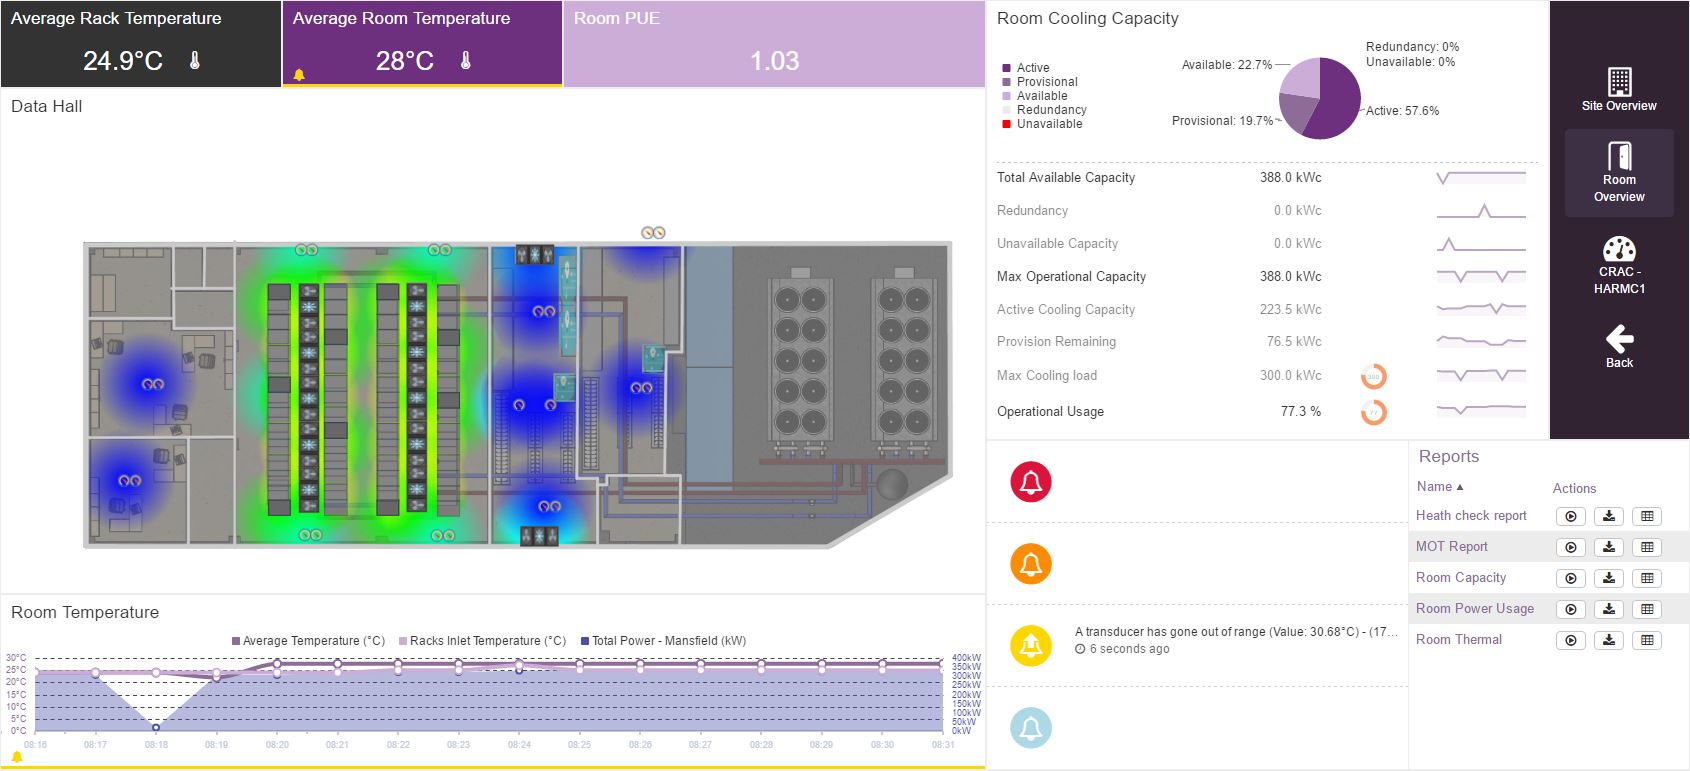
Room dashboards include layout views of the rooms in your estate, and show the equipment in place. With temperature sensors in place, the room layouts act as heatmaps, making it easy to identify hot spots and cold spots. Do you need to ‘drill down’ further into the data? No problem – simply select a sensor on the layout and sensor data is shown in a pop-up.
Fast Access to Holistic Data via Dashboards
Layouts are just one way of presenting environmental data in SMARTset. You can also create customisable dashboards and add information widgets. There are many widgets available to choose from, including value widgets for monitoring the measurements of specific sensors, graph widgets, pie charts, weather widgets and much more.
You can customise the widgets too, so that your dashboards present you with the precise information you need, in your preferred format. SMARTset can also generate reports, and again, these can be customised to provide you with the information you need to run your estate effectively either on-demand or delivered to you on a schedule.
Discover the Power of Visibility with SMARTset
The more information you have about your estate, the easier it becomes to manage. SMARTset offers quick and easy access to data at all levels, and includes visualisation tools that makes it easier than ever to identify areas for improvement. To find out more, contact sales@4ng.co.uk or call us on +44 (0)115 922 8751.